Across 20 occupations and 50 US metros, the city that pays best in real terms is above the national average cost of living in 19 of the 20. The intuition that a cheaper city leaves you better off is, in this dataset, wrong almost every time.
How we measured it
Real pay is the nominal annual mean wage from the BLS Occupational Employment and Wage Statistics programme, divided by the metro’s BEA Regional Price Parity index over 100. An RPP of 110 means prices run about 10% above the US average, so $110,000 earned there is worth roughly $100,000 in national terms.
That is the whole method. No survey panel, no self-reported salaries - two federal releases, joined per occupation and metro. The full dataset is free to download and the methodology is public.
The same job, worth twice as much
| Occupation | Best real pay | Real | Cost index | Worst real pay | Real | Cost index | Spread |
|---|---|---|---|---|---|---|---|
| Police Officer | San Jose, CA | $126,341 | 110 | New Orleans, LA | $58,144 | 93 | 2.17x |
| Marketing Manager | San Jose, CA | $213,878 | 110 | Boston, MA | $98,772 | 108 | 2.17x |
| Web Developer | San Jose, CA | $141,710 | 110 | Las Vegas, NV | $69,640 | 100 | 2.03x |
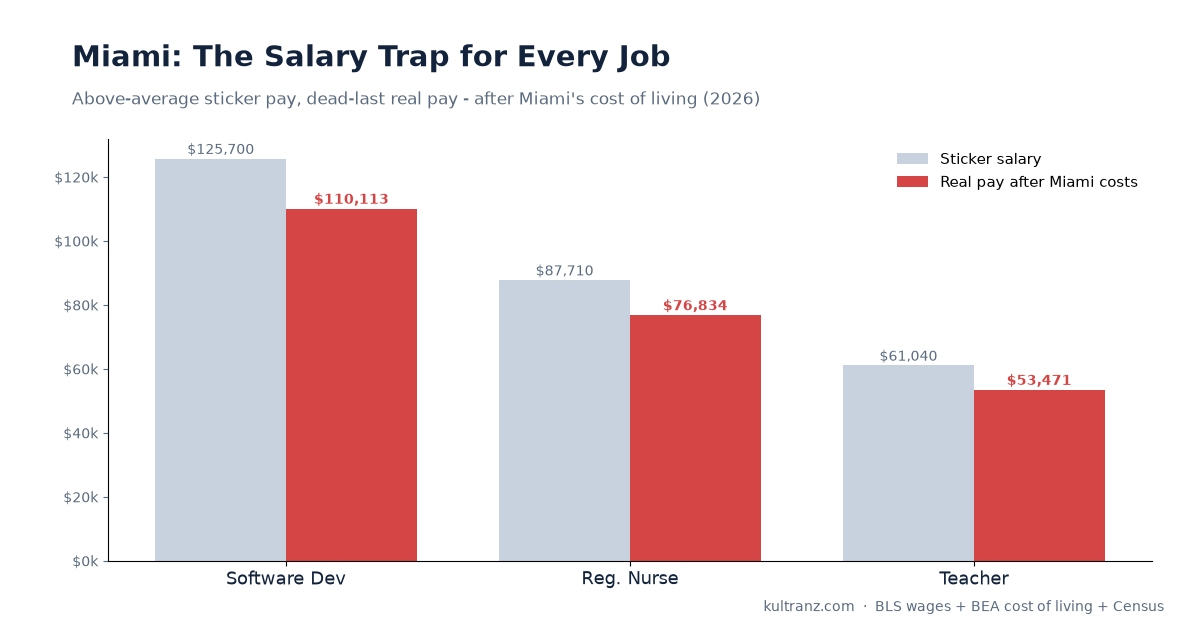
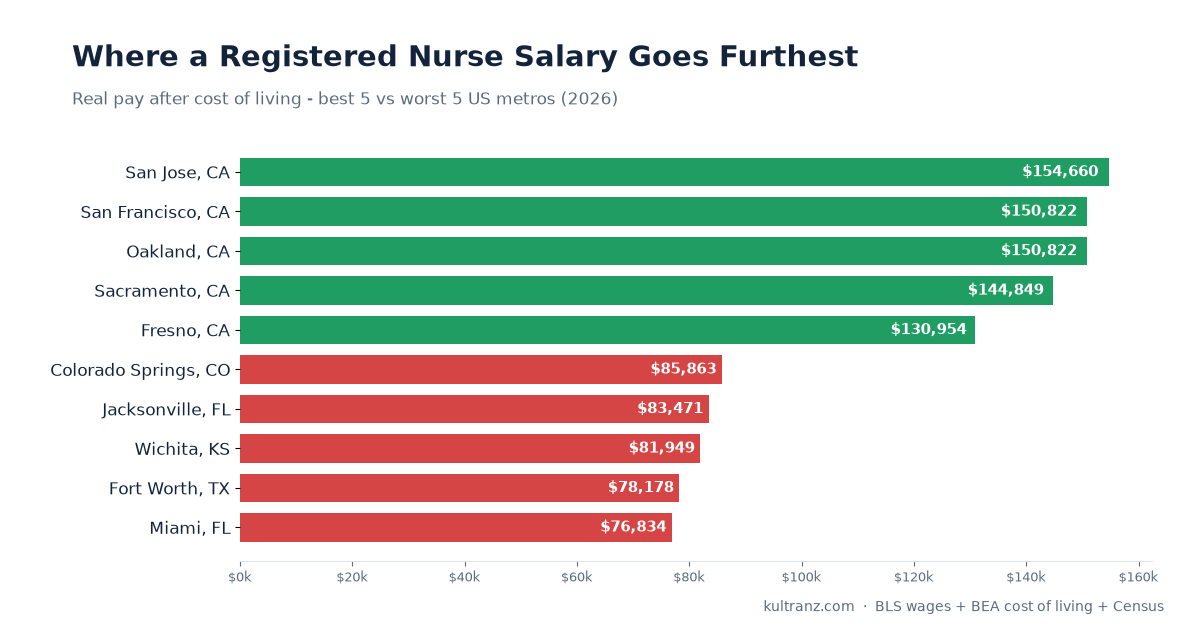
| Registered Nurse | San Jose, CA | $154,660 | 110 | Miami, FL | $76,834 | 114 | 2.01x |
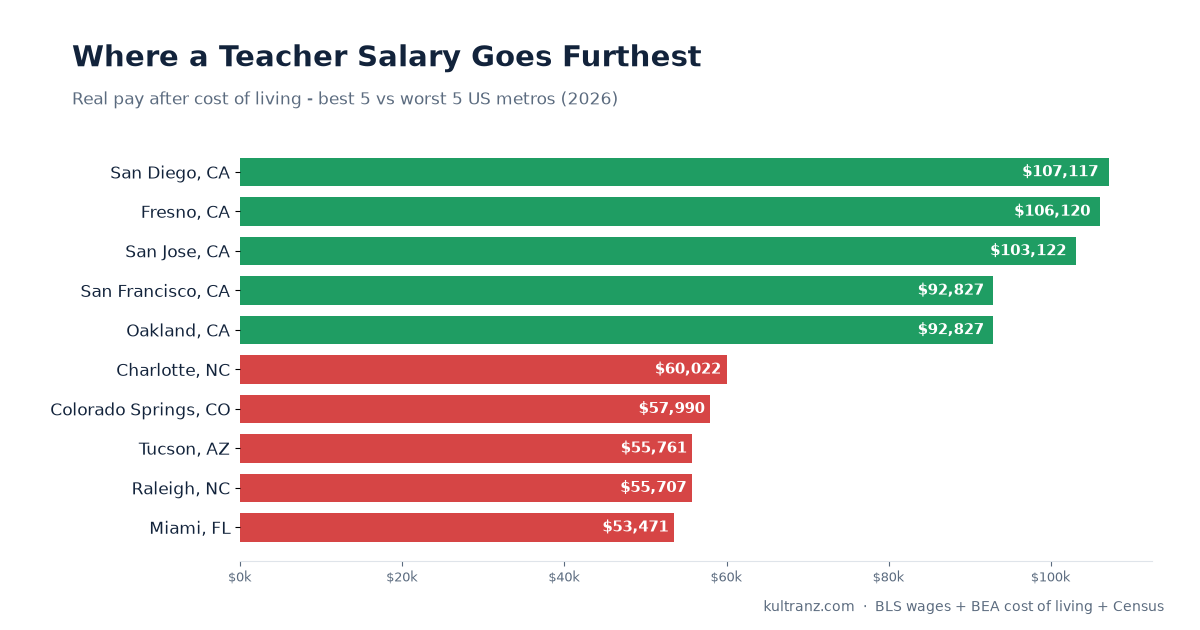
| Teacher | San Diego, CA | $107,117 | 112 | Miami, FL | $53,471 | 114 | 2.00x |
| Project Manager | Denver, CO | $115,946 | 106 | New Orleans, LA | $58,414 | 93 | 1.98x |
| Electrician | San Jose, CA | $92,906 | 110 | Miami, FL | $48,206 | 114 | 1.93x |
| Graphic Designer | San Jose, CA | $93,513 | 110 | El Paso, TX | $48,992 | 90 | 1.91x |
| Data Scientist | San Jose, CA | $163,408 | 110 | Albuquerque, NM | $90,689 | 96 | 1.80x |
| Paralegal | San Jose, CA | $94,047 | 110 | Wichita, KS | $53,875 | 89 | 1.75x |
| Financial Analyst | New York, NY | $130,105 | 113 | Louisville, KY | $74,962 | 93 | 1.74x |
| Dental Hygienist | San Jose, CA | $114,546 | 110 | Oakland, CA | $66,346 | 116 | 1.73x |
| Human Resources Specialist | San Jose, CA | $103,801 | 110 | Miami, FL | $61,627 | 114 | 1.68x |
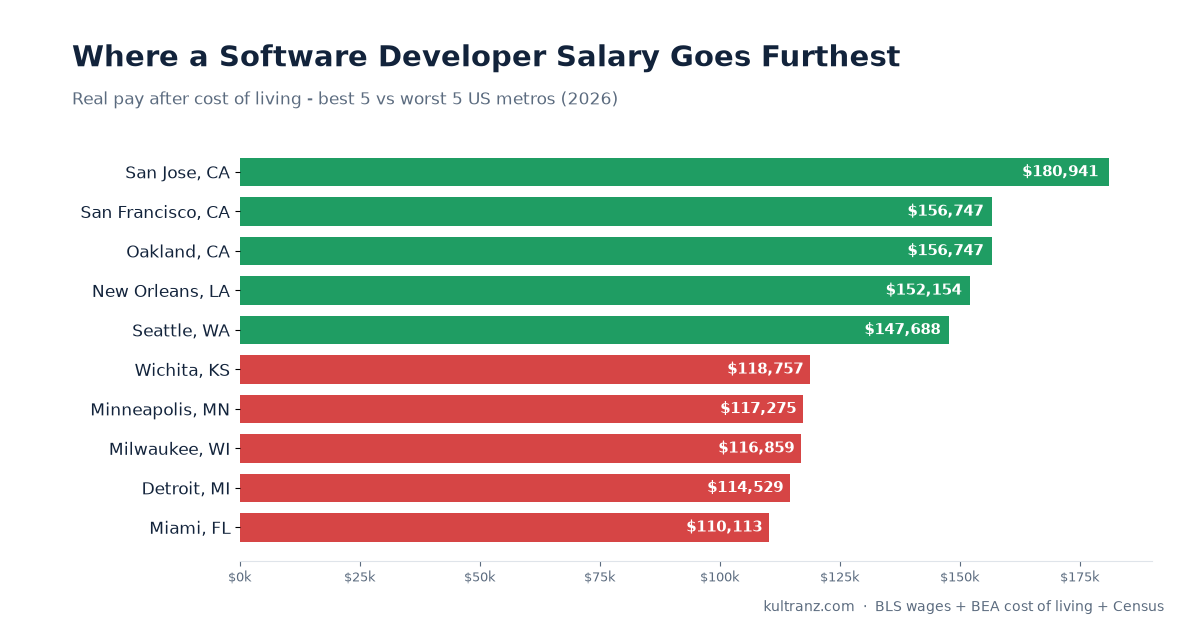
| Software Developer | San Jose, CA | $180,941 | 110 | Miami, FL | $110,113 | 114 | 1.64x |
| Physical Therapist | San Jose, CA | $123,525 | 110 | Miami, FL | $76,887 | 114 | 1.61x |
| Mechanical Engineer | San Jose, CA | $140,641 | 110 | Las Vegas, NV | $87,681 | 100 | 1.60x |
| Sales Representative | San Jose, CA | $105,875 | 110 | Miami, FL | $66,436 | 114 | 1.59x |
| Executive Assistant | San Jose, CA | $96,710 | 110 | Miami, FL | $60,996 | 114 | 1.59x |
| Accountant | San Jose, CA | $112,359 | 110 | Las Vegas, NV | $71,317 | 100 | 1.58x |
| Truck Driver | Memphis, TN | $64,407 | 92 | Miami, FL | $47,768 | 114 | 1.35x |
The median occupation is worth 1.74x more in its best metro than its worst. For a marketing manager or a police officer the gap reaches 2.17x - the same work, more than double the purchasing power.
San Jose wins 16 of 20
One metro takes the top spot in sixteen of the twenty occupations, and it is not a cheap one. San Jose carries a cost-of-living index of 110 - a 10% premium on the national average - and still produces the highest cost-adjusted pay for accountants, nurses, electricians, police officers, paralegals and software developers alike.
The reason is arithmetic rather than magic. Wages vary between metros far more than prices do. San Jose’s cost premium is 10%; its wage premium for most of these occupations is 40-100%. A 10% haircut on a 70% raise still leaves a large raise.
The four exceptions are instructive: New York for financial analysts, Denver for project managers, San Diego for teachers, and Memphis for truck drivers - the one genuinely cheap metro to top any list, and the only occupation here whose wages barely move with geography.
Miami is the trap
Miami is the worst real payer in nine of the twenty occupations - nurses, teachers, electricians, software developers, sales representatives, and more. It is the only metro in the data that combines an above-average cost of living (index 114) with consistently below-average wages.
That is the specific failure mode worth naming: not “expensive”, and not “low-paying”, but both at once. Six occupations have their worst real pay in a metro that is cheaper than the national average - Albuquerque, Louisville, El Paso, Wichita, New Orleans - and in every one of those cases, low wages outran low prices.
What this means if you are choosing
- Do not screen cities by cost of living. Screen by pay for your occupation, then subtract cost. The ranking reshuffles, but the expensive cities mostly survive it.
- Check your own occupation, not the average. The spread runs from 1.35x for truck drivers to 2.17x for marketing managers. Geography barely matters in some jobs and doubles your money in others.
- Beware the cheap-and-underpaid quadrant. A below-average cost index is only good news if wages hold up. In six occupations here, they did not.
Run your own numbers with the cost-of-living calculator, check where your salary lands with Am I Underpaid?, or query the same figures directly through the API.
Data: BLS OEWS annual mean wages and BEA Regional Price Parities, 2026 vintage, 20 occupations across 50 US metro areas (890 occupation-metro pairs with complete data). Figures are estimates from public data, not personalised financial advice.